Gantt Chart
The Gantt chart in Deepser provides a visual timeline of your project tasks, showing dependencies, milestones, and progress at a glance. You can access it directly from any saved project.
To view any project on the Gantt chart, click the button in the top-right corner that appears after the project is saved.

Task Table
The Gantt chart is divided into two main parts. The first part contains a table with all the tasks for the project. The header columns represent fields of the Task model.
There are unlimited levels of tasks. As shown in the screenshot below, you can create:
- First-level tasks by clicking the main + button.
- Subtasks by clicking the small + button on the right side. You can also copy and delete subtasks using the yellow and red icons on the right side.
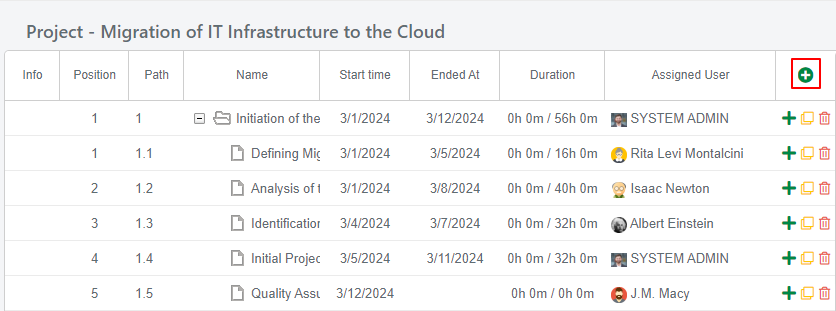
Chart Controls
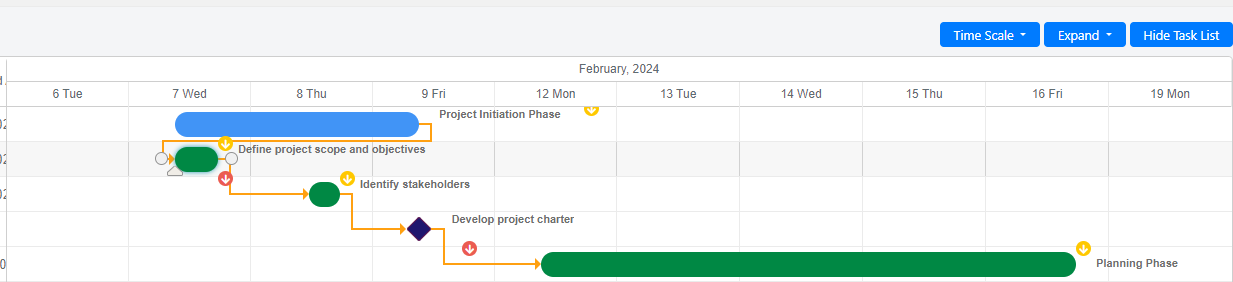
The chart visualizes all tasks based on their start date and duration. The following controls are available:
Time Scale — Scales the Gantt calendar based on the selected option. The default time scale uses the project's "Default Time Scale" value. For example, if the option selected is 2 weeks, the chart is divided into two-week duration columns.
Expand — Defines the level of tasks shown on the chart. The Level 1 option displays all main tasks, and Level Max shows all tasks and subtasks. If there is more than one level of subtasks, a new level option appears in the list. For example, if a subtask has its own subtask, a Level 2 option is added to the list.

Hide Task List — Click this button to hide the tasks table.
Legend
- Task Bars: Represent individual tasks or activities within the project. The length of a bar indicates its duration. Blue bars are main tasks that have their own subtasks, while green bars do not have subtasks.
- Dependencies: Orange arrows indicate relationships between tasks. The arrow starts from the source task and points to the dependent task.
- Deadline indicator: The yellow arrow on the chart is visible when a task has a Deadline Date.
- Constraint indicator: The red arrow on a task means there is a constraint for that task. Hover over the arrow to see the constraint type.
- Milestone: The milestone symbol represents a task marked as a Milestone (the "Is Milestone" toggle is set to "Yes").