Configure Dashboard Charts
Charts allow you to create visual representations of your data on dashboard panels. You can configure different chart types such as pie, bar, and line charts to display the metrics that matter most to your team.
Add a New Chart
To configure a new chart, follow these steps:
- Navigate to System > Dashboard > Chart in the Deepser Backend.
- Click the Add Chart button in the top-right corner.
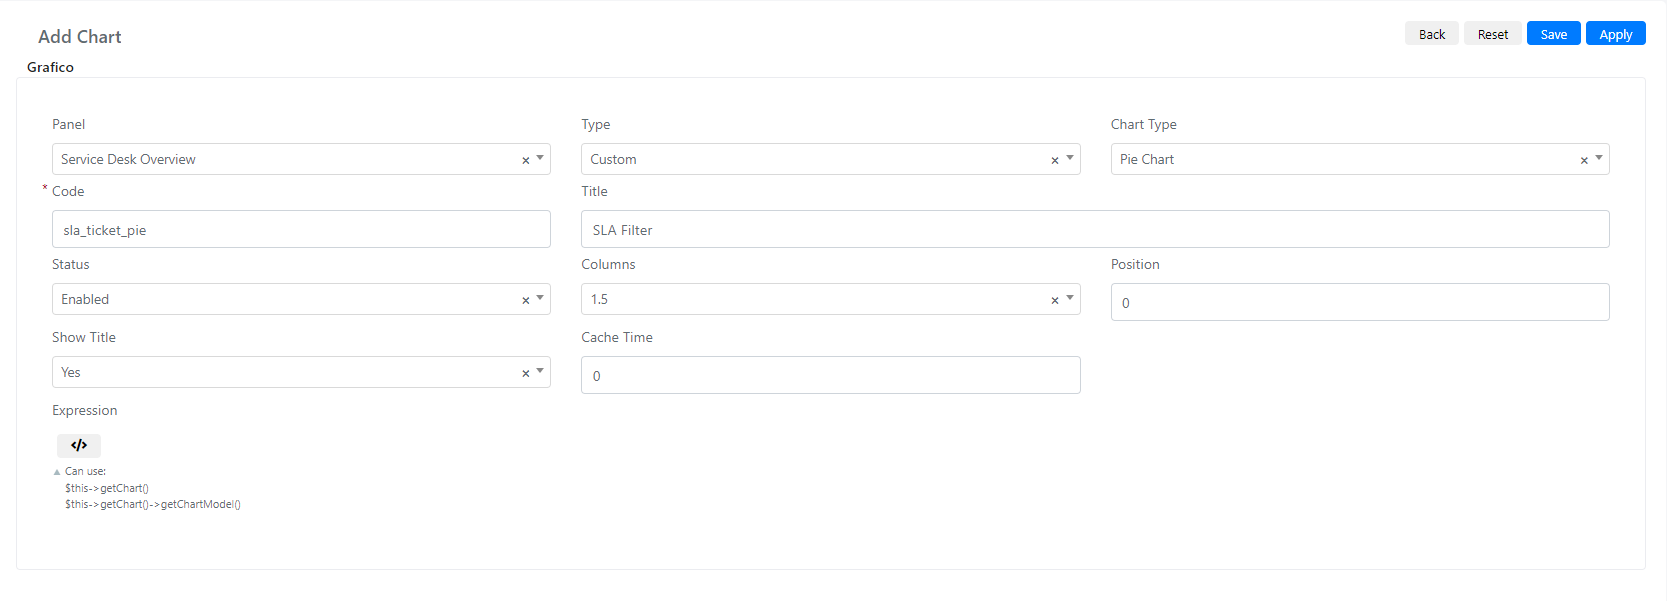
Chart Fields Reference
The table below describes each available field on the chart configuration form.
| Field | Description |
|---|---|
| Panel | A select field to choose which panel you want this chart to appear on. |
| Type | If selected, you can create a chart of a custom type. |
| Chart Type | Only visible if a custom type is selected in the field above. Contains different chart types such as pie, bar, horizontal, line, etc. |
| Code | A unique key to identify the chart. |
| Title | The display name of the chart. |
| Columns | Represents the width of a chart square on the panel. |
| Position | The position where the chart will be displayed on the panel. |
| Cache Time | The duration for which chart query results are saved in the cache. |
| Expression | Contains all the custom code and database queries needed to style the chart and populate it with data. |
For example, to create a simple pie chart showing Service Operations by status, you would set Chart Type to "Pie" and write a database query in the Expression field that groups Service Operations by their status field.
warning
Chart configuration requires a deep understanding of advanced coding within the scripting area. Chart datasets can only be manipulated through the "Expression" field.