Survey Dashboard
The survey Dashboard provides a clear and concise visualization of key data and real-time information about your created surveys. Use it to analyze responses, filter results, and export survey data.
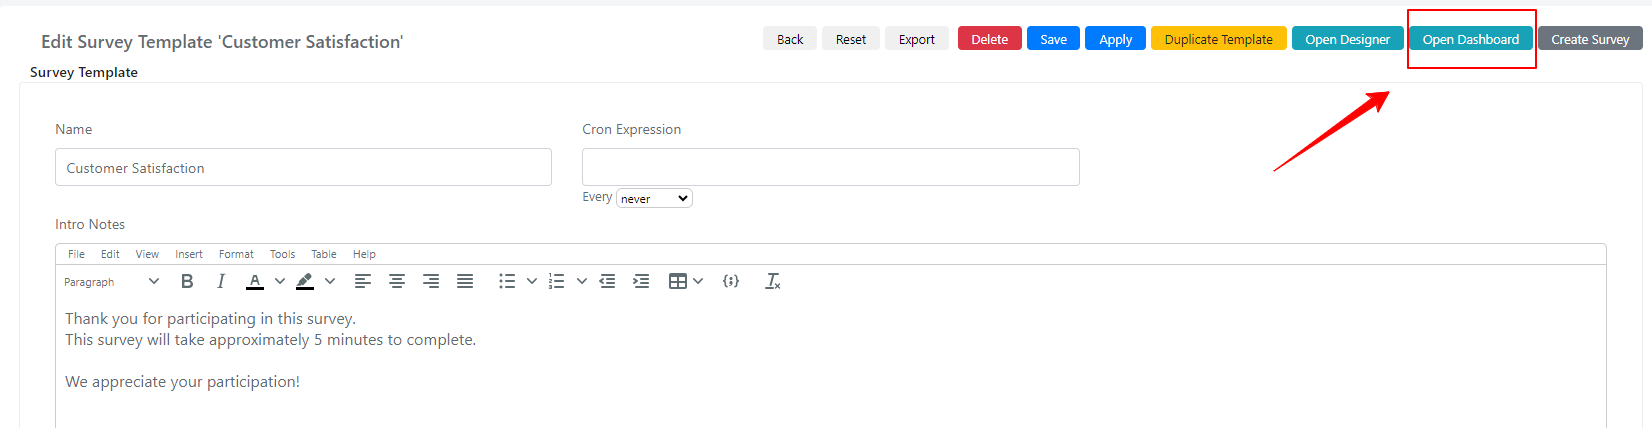
You can access this module from the main menu by navigating to Survey > Dashboard. Alternatively, you can access it from a Survey Template by clicking the Open Dashboard button in the top-right corner:
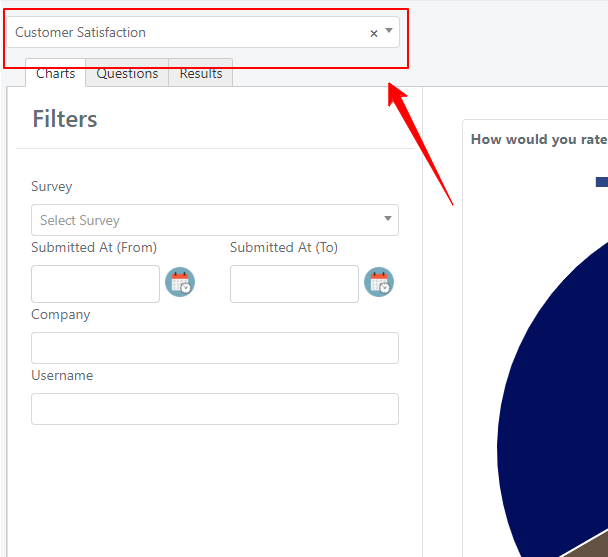
To load data, select the base template you want to analyze using the field in the top-left corner. All related surveys will then be loaded:
In the Dashboard, survey results are analyzed and filtered based on the questions, and they are also visualized in charts.
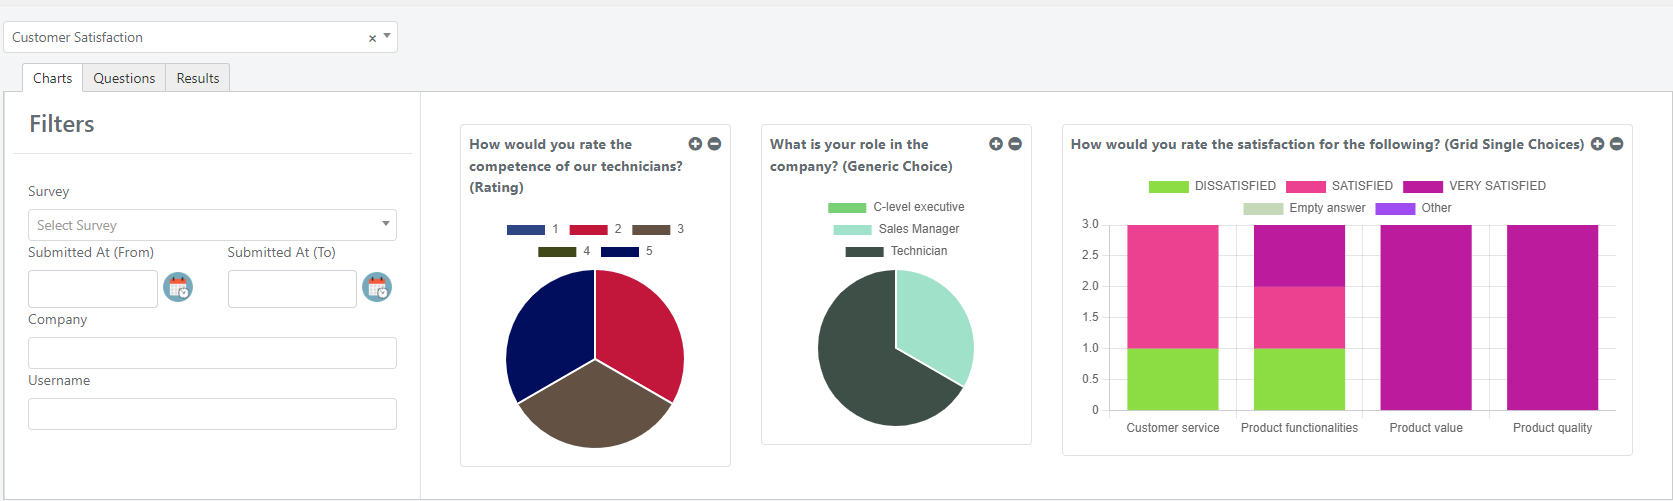
Charts
On the left side of the filters panel, you can set different filters that control the data displayed in the charts.
Submitted At From -- To: Date fields where you can set a date range. Results will be filtered based on the date they were submitted.
Company: Multiselect field that filters results based on the company field.
Username: Multiselect field that filters results based on the user who submitted the survey.
Questions
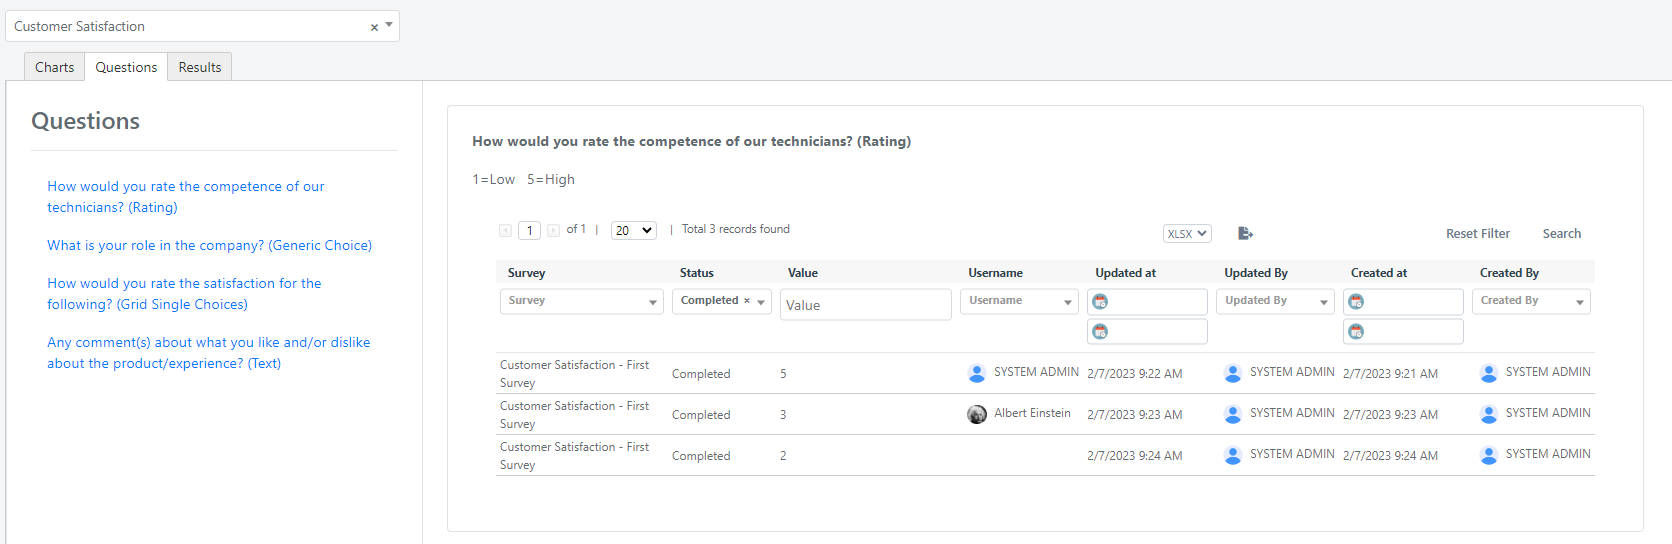
Within the Questions tab, you can access the answers related to a specific question. This comprehensive view provides valuable information such as the submission time and the source from which it was submitted, offering insights into the respondents' identities and the timing of their submissions.
Results
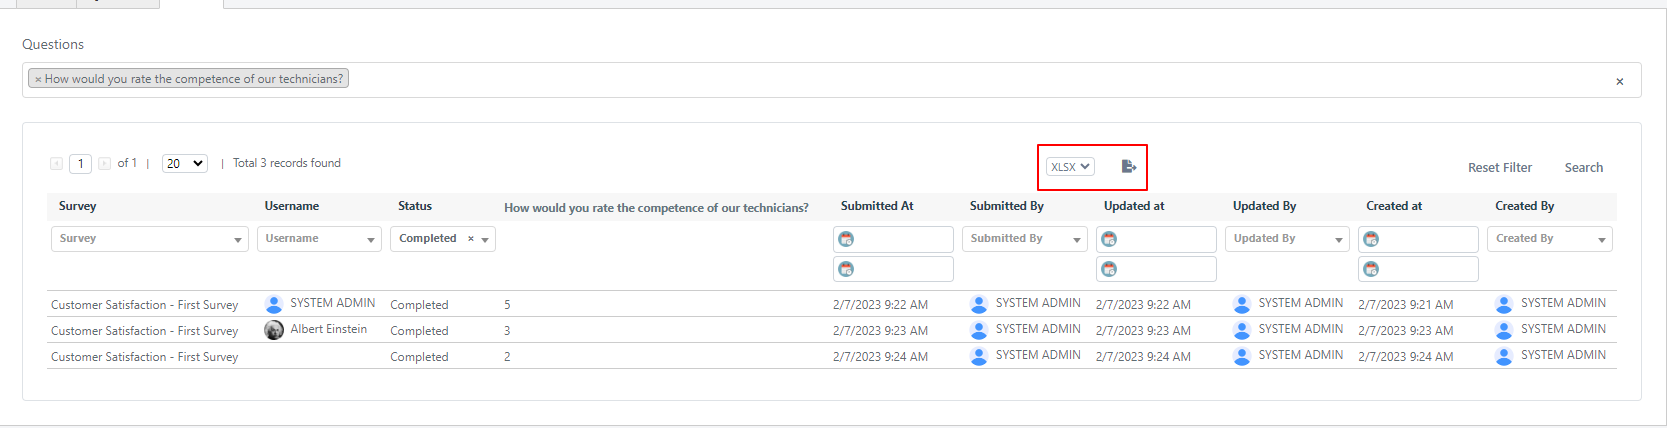
The Results tab displays a grid with all the results related to a survey.
Questions: This is a multiselect field that filters results on the grid based on the questions selected.
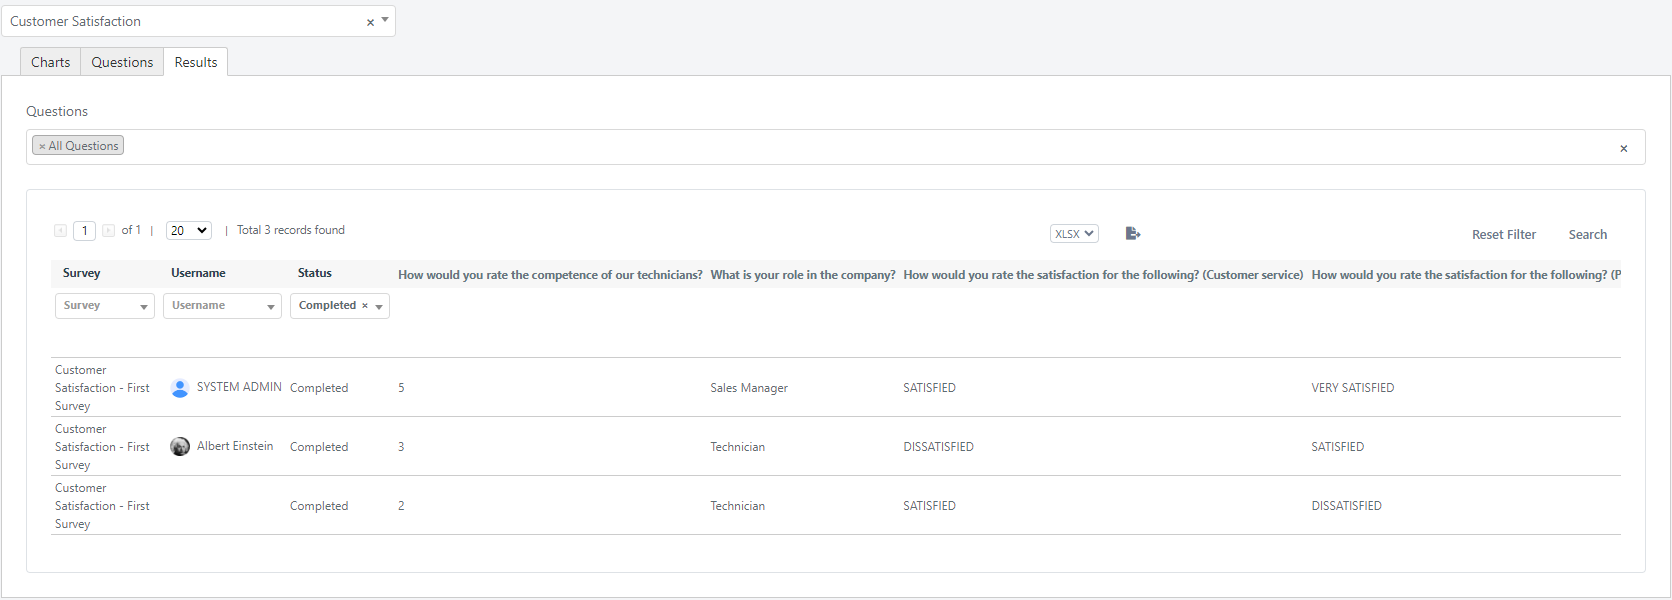
In both the Results and Questions tabs, you can export data in CSV or XLSX format from the relation grid using the default export button.